What is Sensitivity Analysis? What is Screening?
Sensitivity analysis is used to quantify the impact of input variables (parameters) on the output variables (response). For the specific case of flow modeling, it can be used to:
- Aid in the understanding of reservoir dynamics--which parameters are important which are not.
- Quantify the impact of the engineering and geological assumptions on reservoir response (well pressures, rates and fluids in place)
- Identify, quantify, and correlate the uncertainty in input parameters to the uncertainty in flow response.
The purpose of screening is to select models from an ensemble of models that have particular features or characteristics. For the specific case of flow modeling, screening can be used to:
- Select a smaller yet diverse set of models from a much larger of reservoir models for uncertainty quantification of response variables.
- Identify "good" models as starting point for both field-level and well-level calibration (history matching).
Traditional Sensitivity Analysis and Screening in the Oil and Gas Industry
Simple, traditional methods of sensitivity analysis involve adjusting one parameter at a time, running a flow simulation, and evaluating how the reservoir response changes in relation to the parameter variation.
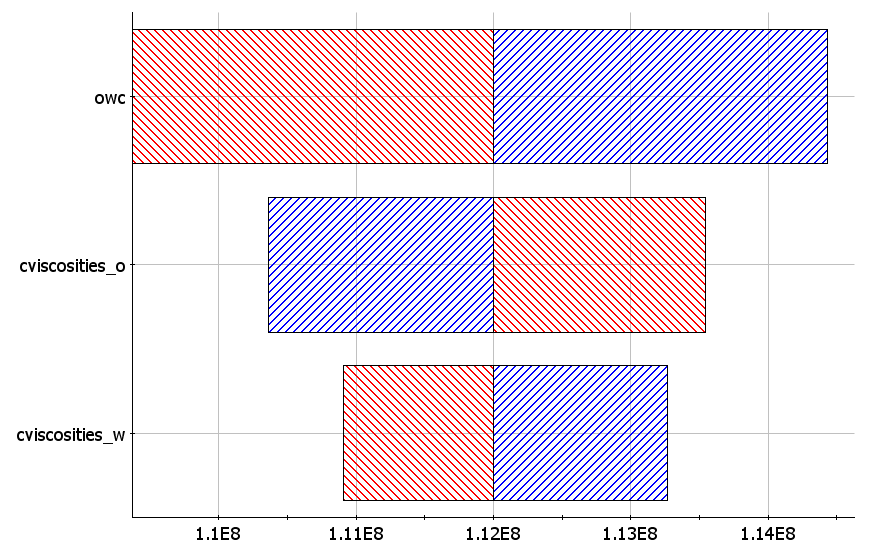
The results are presented in a tornado plot, where the x-axis represents the response of interest, such as cumulative oil production after 30 years. Each horizontal bar depicts the change in response due to variations in a specific parameter. Parameters with the greatest impact appear at the top, creating the characteristic tornado shape. In this example, oil-water contact has the most significant effect on cumulative oil production, while water viscosity has the least influence.

Another traditional approach is Monte Carlo simulation, where parameter values are randomly sampled from a probability distribution for each run. The response of each run is then plotted against the corresponding parameter value. The strength of the correlation between the response and the parameter indicates its significance. Correlation coefficients range from -1 (perfect inverse correlation) to 1 (perfect positive correlation), with values near 0 indicating no correlation, meaning the parameter has little to no effect on the response.

Other, classical methods for sensitivity analysis use responses surface methodology (RSM) and experimental design (ED) to determine which parameters have a high impact on a given response. The use of response surfaces has certain advantages and disadvantages - for more information, click here.
In geological reservoir model selection, screening is often performed using simple responses, such as original oil-in-place (OOIP). A common traditional approach is ranking, where reservoir models are ordered based on a specific criterion (e.g., OOIP) from lowest to highest. Models are then selected based on predefined percentiles (P10/P50/P90). However, this traditional screening method presents several challenges:
- Similar to sensitivity analysis, screening with multiple responses—such as oil production from dozens or even hundreds of wells—adds complexity for engineers. It requires evaluating multiple rankings based on individual responses, which is impractical and, in some cases, infeasible.
- Sensitivity analysis and screening are separate processes. Sensitivity analysis examines how variations in input parameters affect a response, while screening selects models based on ranked responses. Effective screening may require significantly more runs than those defined by experimental design.
A Novel Approach to Sensitivity Analysis and Screening
Streamsim has introduced a novel approach to sensitivity analysis based on the concept of a metric space (detailed in the metric space overview). This Generalized Sensitivity Analysis (GSA) method is specifically designed for engineering complex reservoir systems, where identifying the most influential model parameters and their interactions is crucial for decision-making.
Reservoir modeling incorporates parameters from various disciplines—geophysical, geological, and engineering—with diverse characteristics, including continuous, discrete, and scenario-based variables. The GSA method classifies response or decision variables into discrete categories by clustering models within a metric space. The core principle of this approach is straightforward: if the frequency distribution of a parameter remains consistent across all classes, it indicates no sensitivity, whereas deviations suggest sensitivity.
This methodology leads to a new, general measure of sensitivity that not only quantifies parameter interactions but also accounts for their asymmetric nature in complex reservoir modeling.
Example
A total of 200 sensitivity runs are generated by varying five key parameters: the Corey water exponent (watExp), maximum relative permeability for water (krwMax), Kv/Kh ratio (KvKh), residual oil saturation to water (SOWCR), and the training image (TI), which represents six distinct depositional environments. The TI parameter is discrete-valued, making it particularly challenging to model using traditional sensitivity analysis methods like Experimental Design (ED) and Response Surface Methodology (RSM).
Additionally, the response of interest—the oil production from 20 producers over the full 3.5-year production period—further complicates the analysis and is not feasible using conventional SA techniques. To account for spatial uncertainty, each of the 200 runs is generated with a unique geostatistical modeling seed, ensuring that every run represents a different realization.
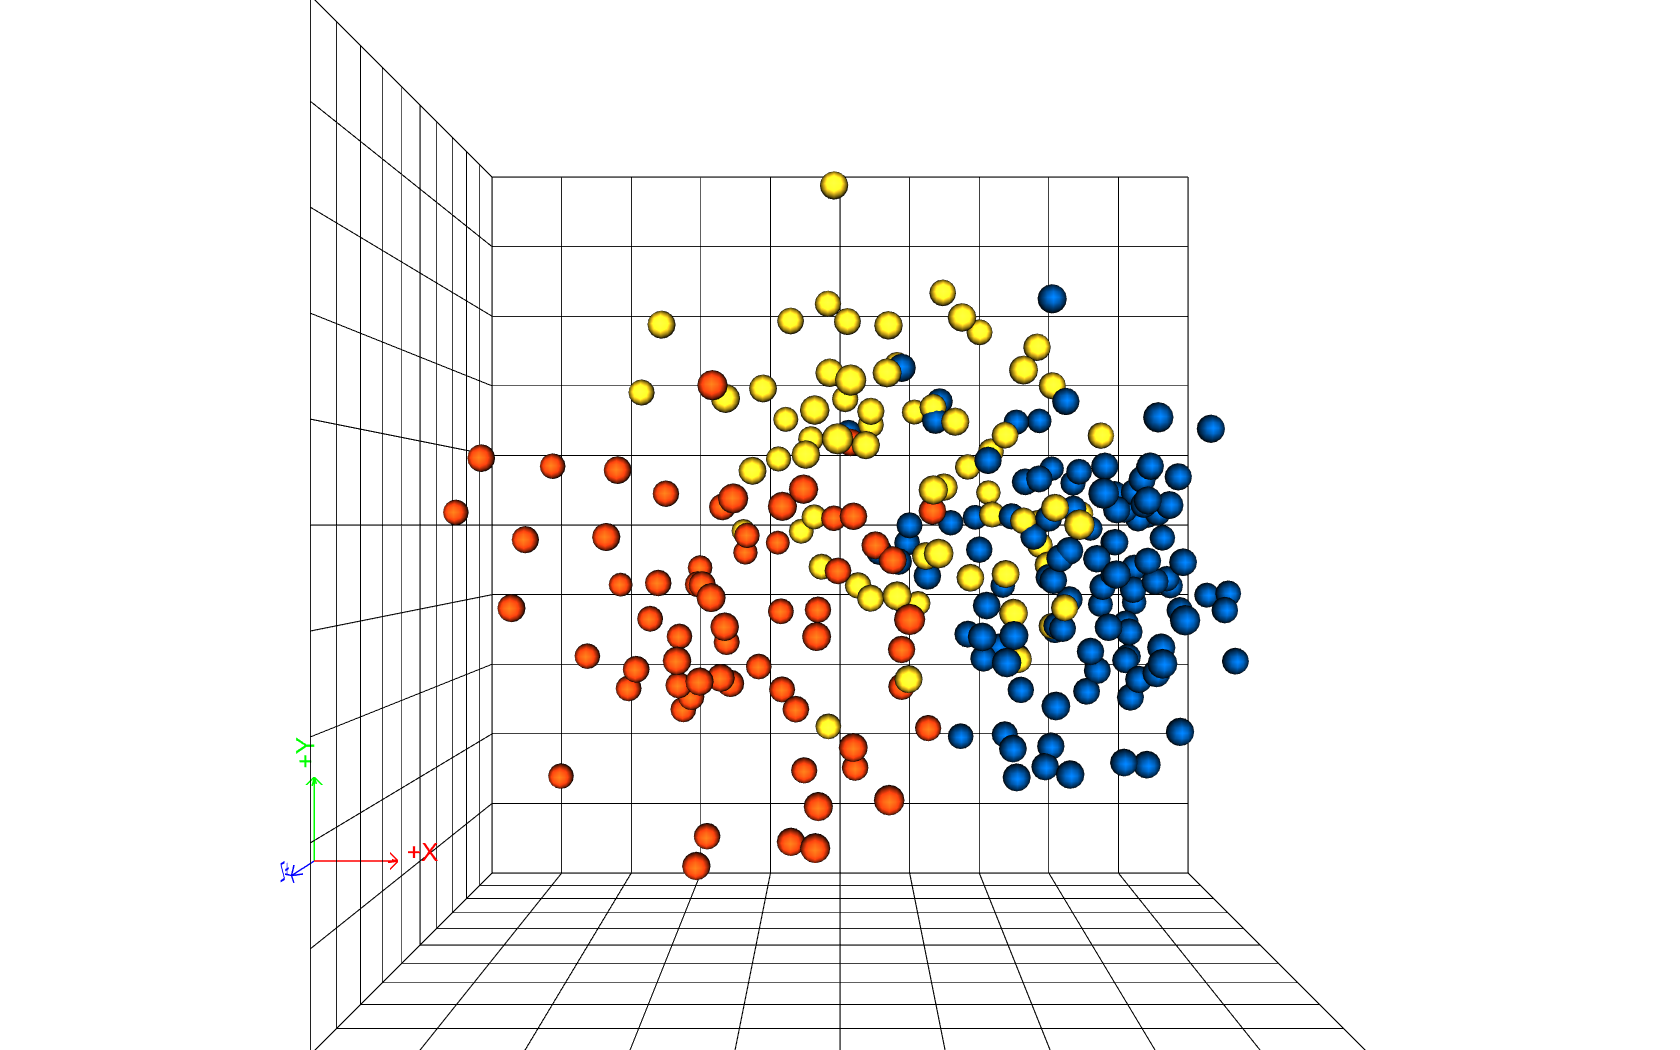
The metric space is displayed in three dimensions, where each run is represented as a point in the space. The color of each point indicates the clustering of the runs, with a total of three distinct clusters.

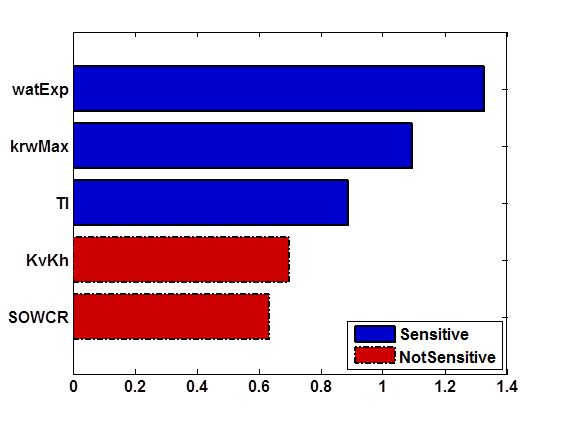
The GSA method identifies three parameters—watExp, krwMax, and TI—as sensitive, highlighted in blue. The length of the bar represents the degree of sensitivity, with watExp being the most sensitive and SOWCR the least sensitive.

Advantages of Generalized Sensitivity Analysis
The metric space methods for sensitivity analysis and screening outlined above should be viewed as complementary to classical techniques. However, this approach offers several advantages:
- Any type of parameter, discrete or continuous, can be analyzed in this manner.
- No response surfaces are created - the analysis is directly using the models transformed into metric space. Consequently, there is no requirement that the modeler assume a functional form of the response.
- Spatial uncertainty (stochastic noise) is handled naturally in the GSA approach
- Multiple responses can be considered
Screening in Metric Space
Once the sensitivity analysis stage is complete, the screening step follows naturally. It’s important to note that cluster analysis itself serves as a form of screening—no additional runs, software analysis, or methods are needed. Clustering groups similar models and distinguishes those that differ. If the goal of the screening step is to select a diverse set of models, one could choose a model from each cluster (such as the cluster centroid). If the objective is to select models that are closest to historical data, the models from the cluster closest to the historical data should be selected. For more on screening using metric spaces and history matching, click here

