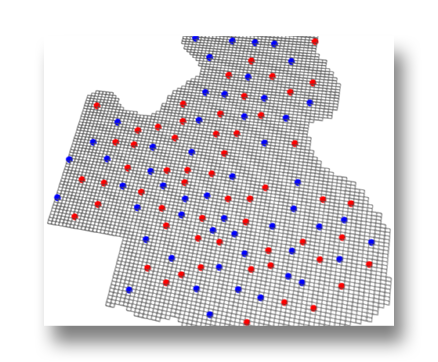
Compute streamlines
With well locations, the injection and production history, and a grid defined, calculate the streamlines throughout history. The image to the left shows streamlines, as colored by originating injector, for one time interval only. Because historical well rates change, streamlines are computed at each timestep that history is defined at.
Surveillance does not involved the transport of fluids along the streamlines so calculations are fast and efficient.
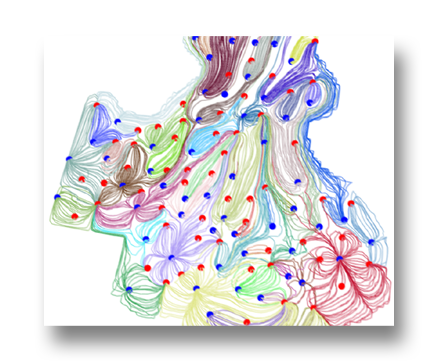
Flux Pattern Map
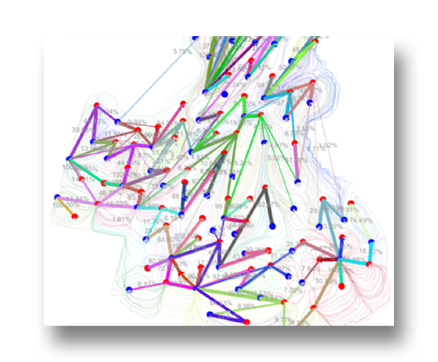
Combine the streamline bundles between each well-pair and represent them as a graph. This is Streamsim's patented Flux Pattern Map (US Patent 6,519,531), designed to quantify the strength and allocation factors between wells. Since streamlines evolve over time, the FPmap also changes dynamically, offering a real-time representation of your flood pattern. By combining maps over multiple timesteps, you can visualize average patterns and allocation factors across the specified time range.
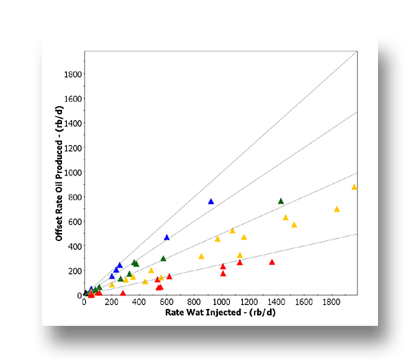
Injection Efficiency
After identifying well-pairs and calculating well-rate allocation factors, studioSL can generate an injector efficiency (IE) plot to summarize injector performance. Each point on the plot represents an injector and corresponds to an offset oil rate produced, shown on the y-axis. The IE plot serves as a powerful diagnostic tool for evaluating the efficiency of each injector in the field.
Target Rates From floodOPT
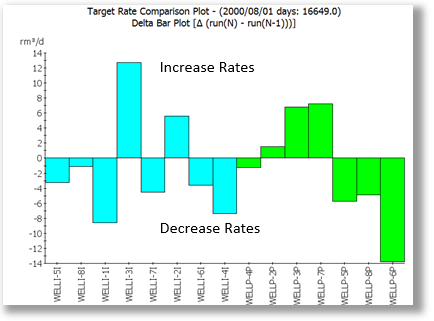
Using the injection efficiency for each well-pair, floodOPT can compute new well rates to strengthen low-water cut connections and high-water cut ones. A plot or list of suggested new well rate targets generated by floodOPT provides a strategy to improve sweep efficiency and minimize cycling.
The delta target rate changes, shown in the figure to the right, represent total voidage adjustments for injectors (cyan) and producers (green). These calculations can also incorporate field-wide and individual well constraints. Additionally, the output highlights key wells—those with the largest delta changes—helping prioritize initial efforts to enhance flood performance.
Remaining Oil In Place (ROIP)
Using an Original Oil in Place (OOIP) distribution, Streamsim's unique streamline region-based material balance simulator (SLR-MB*) can be applied to each dynamic well-pair to calculate a Remaining Oil in Place (ROIP) distribution. This process identifies areas with low and high ROIP, shaped by the field's injection and production history.
The comparison below illustrates the OOIP versus the ROIP after incorporating historical production data into per-pattern material balance calculations. Red areas represent high values, blue areas indicate low values, and purple areas signify zero values, corresponding to gas cap or water zones.
* SLR-MB is protected by US patent No. 10,726,173 B2

3D Original Oil in Place (OOIP)

3D Remaining Oil in Place (ROIP)
Rapid Forecasting
Regression techniques are used to correlate historical well rates with local grid properties, enabling well-level forecasts of oil, water, and gas production rates. This approach provides a quick and reliable method for forecasting base declines, shut-ins, reactivations, or producer-to-injector conversions for existing wells. Additionally, these surveillance model forecasts can be integrated with Streamsim's floodOPT workflow to predict the impact of new well rate targets aimed at improving sweep efficiency and reducing fluid cycling.
In the example on the left, two active producers with water cuts exceeding 98% were shut in and converted into injectors, each operating at the producer's last voidage rate. This generated three simulation forecasts: the base case with no changes (blue lines), converting producer 1 only (red lines), and converting producer 2 only (green lines). The incremental oil response is significantly better for the conversion of producer 1 compared to producer 2. The bullets on the plot indicate the field's historical rates.


